Hiroko Karan:
We’re moving right along, and I’ll hand the podium over to Mr. James Lap to preside the next session.
James Lap:
Thank you very much. We will now continue with the Political Leadership Session. Will the speakers of this session please join me in the front seats? You know, as Asian Americans we are often stereotyped as humble, as quiet. And sometimes we are accused of neglecting politics. But never more when you hear these next two speakers.
The first one is Dr. S. B. Woo. He is the Founder and Chairman of the National 80-20 Political Action Committee. He is Professor of Physics at the University of Delaware and Former Lieutenant Governor of Delaware State. Do not be fooled by this short bio. When you hear him, he will tell you what 80-20 is about. What are the techniques, and secret behind 80-20? And ladies and gentlemen, it is my pleasure to introduce to you Dr. S.B. Woo.
Dr. S. B. Woo:
Are you hungry? Alright, alright. Time is precious. I’ll be brief. I’ll go almost directly to it, but I’d like to have a moment to provide a comic relief. Most of you know me as a physics professor and I want to tell you what kind of professor I am. I’m a professor who likes to teach large classes – usually a class of about 300, all seated. Introductory physics.
One semester, I had this great, big, tall student who would come to every one of my lectures and sat in the middle of the front row, and three minutes into my lecture he would dose off. And when it happened for the third time, it was beginning to adversely affect my morale and the morale of the entire class so I said oh boy, I’m going to find a nice way to gently nudge him a little.
So one day a bright idea came to me and I went cheerfully to my lecture. Sure enough he came, sat in the middle of the front row, three minutes into my lecture he dosed off. So I called on the student sitting next to him and asked her an easy physics question, what’s Newton’s Second Law? And she said, F = MA. And I then turned dramatically to the dosing student and shouted, “Same question!” He woke up and looked at me puzzled, and then all of a sudden his eyes lit up. He smiled and said, “Same answer.” Now you know why I’m about to retire as a Professor.
Let me get to the topic. The topic is the importance of group political clout, political power, before or after 9/11, but particularly after 9/11. I’ll first define for you what is “group political clout” and then go on to explain why it is important. Then I’ll go on to explain how you can get group political clout to solve many of the problems I heard today and then to illustrate how 80-20, the organization for which I am one of the founders and currently the President, has used whatever clout we’ve gotten now to serve the community.
So what is group political clout? It’s the ability of the group to reward or punish any politician. Any politician. It rewards the politicians who share your rightful concerns and work for you and punishes those who don’t. In more scholarly language, if you talk to any politician, they’ll tell you leverage is the currency of politics. In less scholarly language, it would be to use carrots and sticks. In the language of a politician it would be to talk softly, to think rationally, to analyze institutional interests of your friends and foes, and to always carry a big stick. What stick would a community have? –Your votes. That’s why you need to register to vote and vote as a block – because 50/50 doesn’t matter to any politician. You have to vote as a block.
Now let me say why group political clout is important. Let me tell you, no political clout, no equal opportunity. No equal opportunity. That sounds like a phenomenal, fantastic statement that defies believability. Let me give you proof. I’m going to say a number of things that may sound to you that I’m not that satisfied with this great nation. That is not true. I’m very satisfied with it. I’m only going to do something to help improve on it.
So let me step back and say briefly why I think America is such a great nation. America is certainly the land of opportunity. Many of you perhaps have experienced it personally. And compared to all other nations, America is the most open and inclusive of immigrants. Otherwise most of us wouldn’t be here.
That having been said, you must be aware that there is another aspect of America. America is extremely competitive as a market system and a tough competition. Anything that can be used against your opponent, so long as it is legal, will be used. If you’ve been up at the top level of competition, you will know. And if you are an individual who belongs to a group that doesn’t have that group political clout, believe me, it will be used against you. And Chinatown in New York is one of the best examples. You have a pretty significant population, very few registered voters, completely unorganized, and I’ve seen it repeatedly working against you. And many of the speakers today are talking about it, but you need to do something about it.
Let me prove to you why group political clout is so important. You know, our Constitution says, “all men are created equal”. A great Statement. However, for 87 years African Americans remained slaves; for 144 years, Caucasian women were not allowed to vote. But even after freeing the slaves and getting the power to vote, Blacks and women were mostly enjoying less opportunity until they organized for political clout themselves. It was not until the Blacks organized NAACP, Sudden Christian Leadership Conference, Urban League, together with elected black officials, although, the civic organizations came first and the elected officials (at least the significant ones) came later. And it was not until women organized NOW (National Organization of Women), Emily’s List, and working together with elected female officials (again they came after the civic organizations), that they truly began to enjoy equal opportunity.
You might ask, well Caucasian males enjoyed equal opportunity without struggle. Certainly not. It was about 150 years ago when the Irish, after the great potato famine, came to the shores of America and at first they congregated, mostly in Boston. At that time, discrimination against them was rampant. They were mostly viewed as either perpetually poor or forever drunk. And you might have heard a story that says, a job looks for people and there was an ad in a newspaper in Boston that blatantly stated, “No Irish need apply.” Have you heard of that? Well that was the discrimination that Caucasian males received.
Too bad here is New York and not San Francisco. In San Francisco, my next example will really convince you. You know if there’s any group that’s been openly kicked around for centuries in America, it would be the gays. Remember how anyone took liberty with gays. Not anymore. Why? Because they have organized a gay union. They became a real political power on the West Coast, in San Francisco, my, do politicians need to listen to them! So I have shown you how important it is to have group political clout.
And it is not your skin color, it is rather your lack of organization, not willing to organize, and not willing to do the dirty working in organizing, organizing, organizing that places us in this shape within the great, nice frame of the United States whose constitution certainly allowed us to organize politically and use your power of the ballot box anywhere you want. The fact that I can be standing here and speaking like this is certainly an illustration of the greatness of America. We have to live up to that challenge.
Now let me state how we can get some political clout. Most of you say money, right? No, no, no. What do you think is the most important between money, votes and Electoral College votes? Which one? If you say money, I would say no, because why do you think a politician like me needed money when I was running? I needed money to by TV ads, billboards, and hire campaign staff, in order to get what? Get votes. So if I can interact with an organization and directly get votes, such as 80-20 can now deliver, the votes are much more important to me.
Now let’s talk about the importance of Electoral College votes and regular votes. For a person running for president, what do you think is more important, Electoral College votes or votes? Well you all know a president is not elected by popular votes. Gore got more popular votes, but Bush got elected as a president because he came out ahead on the Electoral College votes. Once you understand that, you understand our opportunity. We have 4% of the nation’s population and only 2% of its registered voters, not so much because we don’t register. People in the west coast actually resister at a rate higher than the national average. People on the East Coast register much less than at national average. But on the whole the reason we have 4% of the population and only 2% of registered voters is because about half are not citizens and therefore can’t vote yet.
Even given that there is a great opportunity before us. What state do you think has the largest number of Electoral College votes? California. How many? Fifty-five for the coming 2004 election and that’s just about 20% of what the next president of the United States will need to get elected. And while it’s 2% of the voters nationally, what is the percentage of Asian American voters in California? About seven percent. That makes a big difference. Seven percent early, primary and 55 Electoral College votes. New York isn’t bad. I believe we’re still decreasing a little bit, but I believe we still have 31 for the next election. In comparison, how many Electoral College votes do you think the great state of Delaware, from which I came, has? We have three. It’s always the number of Senators plus the number of Congressmen. We have two Senators and one Congressman.
How can we be effective in delivering the Electoral College votes to a presidential candidate, for the person who cares about our rightful concerns, and use it against those candidates who don’t (at least in comparison, don’t). That comes to the importance of 80-20’s essential message. Let’s organize to deliver a swing block vote. First let me explain what “swing” is. Swing means we can swing to Democrats if Democrats happen to be serving us well, and swing to Republicans if Republicans happen to be serving us well. But where is the power of block vote?
Let me give you an example that I think you will enjoy. Look at the volume of these two [the two microphones]. One is roughly ten times larger than the other one. And let’s say Josephine and I are two candidates running in the same district, competing for a given position. So if you happen to be one of the two candidates, I’m making it simple – in this particular election district, for simplicity’s sake, there are only two constituency groups, one is the size of 10 times the other – 10 million votes to 1 million votes. If you were the candidate, which group would you call after? Most of us say the large one.
Well my question is unfair because I perhaps set you up a little bit. Any politician would not just decide which group to call after purely by size. We also study its historic voting pattern, how they have voted in the past. Let me say that I am the naïve politician. I look at the size, only I call out to this one. And I’m a fairly practical campaigner, so after large community, more money, more time, but I am pretty good in campaigning. Just a few days prior to the election every leader in that community pats me on the shoulder and says, S.B. we like you. You’ve got it. You’re going to win our community. Just like some of our leaders in the past have done it, but few leaders could deliver votes in the past. And sure enough, when the votes were open, I won that community by a margin of (listen carefully) 52% to 48%. What’s the difference between 52 and 48? Four percent, right? What’s 4% of 10 million votes? Believe me, I’ve done it, worked it out in long hand, it’s 400,000 votes. So I came out of that community 400,000 votes ahead. Pretty good. Josephine is the astute politician. She says hey, that community is like the Jewish American community, which can deliver 80-20. That’s our namesake – concentrating 80% of the votes and money to give it to the politician who cares for our rightful concerns.
And actually the African American community voted for decades at a ratio of 90-10 for democratic presidential candidates. Now you know why the Democratic Party always has an inclination for the African American community. So she courted after that community, and won that community. So what’s the difference between 80% and 20%? Sixty percent. What’s 60% of one million votes? 600,000. So I come out of this community loosing 600,000 votes, winning 400,000 votes, therefore at the end of the day, which candidate has won the election? Josephine has won. Now that is the power of block vote. A small community with unity can get significant political clout because you can affect the personal interest of a politician.
Well now let me illustrate to you how 80-20 has used the political clout that we have established through hard work organizing, organizing, organizing, and used it for the community. As Professor Lien would tell you, Professor Lien was one of the Professors who worked with other professors from Harvard, Yale and Florida in doing a formal post-election survey, that was partially funded by NSF. NSF stands for National Science Foundation. Have you heard of that organization before? Only nation’s highest scientific fund-granting agency. Anything that’s supported by NSF, you know would have the highest scientific standard.
The ethnic break down in that pole – huge pole – 2,020 persons, national pole. Each phone call takes 20 minutes. Translation will be provided for anyone speaking Chinese, Vietnamese, or Korean. All the breakdowns, whether it’s geographical distributions or ethnic distributions, are all done properly, and that vote showed that Asian Americans…
By the way, going back a little bit, back in 2000, 80-20 decided in comparison that the Democratic Party had served us a little bit better. We were not satisfied with the service of the Democrats either, we stated so clearly in our press release, we endorsed Gore. So having released and sent out TV, radio programs, newspaper ads – ads, spending money to do – we got the nation to vote, Asian Americans to vote 2-1 for Gore. Now that’s significant. It’s not quite 80-20 yet but that translates into something like 66 and 34. In California, where 80-20 really concentrated, the figure I got was Asian Americans voted 72.5 for Gore, 18.5 for Bush. Now once you have proven that once, and I think chances are we need to prove it once more in 2004. We’ve got some clout.
Whether it’s the recent A&F, Abercrombie and Fitch t-shirt event – How many of you heard of that event? They came up with a line of four new t-shirts that give a derogatory characterization of Asian Americans and when we heard about it, I placed a phone call with Michael Jeffery, CEO of A&F (short for Abercrombie and Fitch), and in a very cordial soft tone, I said, let’s look work out this problem. We had two institutions trying to work out a problem together. We are not pleased with those t-shirts at all. Would you please consider withdrawing them? That phone call was made around 10:50 East Coast time that particular Thursday. And I said, you don’t know about 80-20, let me introduce it to you. We have 430,000 Asian American families’ email addresses on us and we can email them in one day. There are folks within our organization, incensed by your t-shirt, who are advocating that we should send an email out and ask them to never buy A&F products anymore and go and tell their friends and relatives never to buy it anymore. And I said, of course this is not our current position. Call me back, here’s my number. If you don’t call me back, I got your message too. Within two hours the COO, Chief Operating Officer called me back and in no uncertain terms said, we are withdrawing those t-shirts. That’s a small thing, one of the fortune 500 companies.
A bigger thing would be during the 2000 election, one branch of the Republican Party (and that’s nothing against Elaine or Ms. Tang over there), ran a political TV ad in a small Midwest town against Asian Americans. It basically a take-off of the infamous Daisy ad. What it said was Clinton and Gore had it so easy to get Chinese money that they gave away high tech and China learned to make missiles that can hit the United States. And then it switched to a little girl pulling off the petals of a daisy counting down 9, 8, 7, switch to a mailbox, 3, 2, 1 white flash. Now if that’s not fanning of Yellow Peril, I don’t know what it would be. The only reason they did it in a small Midwest town was because there were no immigrants in there. Therefore, they are not likely to get backlashes.
We learned about it at 9:00 in the morning, took a vote within the Steering Committee, and decided to go against it. Immediately we sent out an email to 430,000 of our supporters and asked them to organize to vote against the Republican Party in contested states. Up to then, we only concentrated in California, but because of this we decided to play serious politics with them, unless they’d withdraw. I made a personal call to Chairman of the Republican National Committee, to whom I’d talked many times of course, saying you withdraw it, or else we’ll never forgive you. Within one day, that TV ad was gone.
And we have some influence in terms of appointment of two Asian American cabinet members. There’s no time to tell you about it. We started a campaign in one given day, and two days later our then head of the transition team, Vice President Cheney called Norman Mineta to ask him if he wanted to serve on President Bush’s Cabinet. But let me end, if you register to vote, understand the importance of group political clout.
We’re not just helping ourselves; we’re helping to make America quote/end quote “a more perfect union.” We’re indeed fulfilling the noble American vision of equal opportunity for all Americans and we are fulfilling our solemn promise to the flag, and all of you have done it, with the hand over your heart, and you say, “With liberty and justice for all.” Thank you.
James Lap:
Well if you are interested in joining 80-20, Dr. Wu, Dr. Ngee Pong Cheng, and Josephine will help you. Our next speaker is another scholar and expert in politics. Dr. Pei-Te Lien is a graduate of the National Taiwan University who holds a M.A. in Journalism and Mass Communications and a Ph.D. in Political Science from the University of Florida. She is currently an Associate Professor of Political Science and Ethnic Studies at the University of Utah. Dr. Lien is the author of The Political Participation of Asian Americans: Voting Behavior in Southern California (1997) and The Making of America through Political Participation (2001). She also publishes widely on issues of race, gender, and Asian American politics and behavior in professional journals and edited book volumes. Ladies and gentlemen, it is our pleasure to introduce to you Dr. Pei-Te Lien.
Due to technical difficulties, Dr. Pei-Te Lien’s presentation is not being transcribed. In substitution, a paper prepared by Dr. Lien for this conference is included in the following pages.
What Do Asian Americans Think and Act Politically? Findings from the 2000-01 Asian American Political Survey
Pei-te Lien
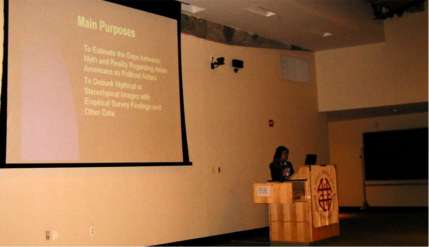
What do Asian Americans think and act politically at the dawn of the 21st century? To what extent and in what ways are they becoming socially and politically incorporated into the American mainstream? To what extent can they be conceived as a collective political body? And, importantly, how do their attitudes and opinions compare to the stereotypical images of Asian Americans that seem to permeate the U.S. mainstream? In this report, I present selected findings from the first multi-city, multi-ethnic, and multi-lingual political survey of Asians in the United States, the Multi-Site Asian American Political Survey (MAAPS), conducted after the November 2000 election. My primary purpose is to debunk mystical and stereotypical images of Asian Americans as political actors by highlighting the gaps between myth and reality with empirical survey and census data.
What are the Myths? There are at least 14 prevailing misconceptions regarding Asian Americans and their political behavior that have been created and recreated in recent years by the U.S. mainstream media and politicians:
- They are the yellow race, monolithic, all the same
- Foreigner, for most are foreign-born
- Unassimilable, can’t speak English
- Apathetic, uninterested in politics
- Uninformed about U.S. democratic political system
- Do not trust the U.S. political system and government officials
- Don’t vote, unwilling to become politically integrated
- Have greater interest and involvement in homeland politics
- Hyperactive in making illegal campaign donations
- Clannish, don’t mix up with people of other origins
- Model Minority, complacent, issue free
- Conservative, Republican
- Politically fragmented, can’t vote as a bloc
- Have no sense of a common identity and consciousness
Together, these myths help create the ambivalent and paradoxical status of Asian Americans in U.S. politics. Asian Americans are considered simultaneously as apathetic and hyperactive in political participation and as monolithic and fragmented in group outlook. They are viewed as a foreign community that is culturally, socially, and politically unassimilable, but also as a model minority that is unencumbered by social inequities and not in need of government services. By presenting findings of the political attitudes and opinion of Asian Americans through a randomly drawn large-scale sample survey, bolstered by data collected by the U.S. Census Bureau, I hope to show that, although there are gaps of various width between myth and reality, none of the myths can survive empirical verification and scrutiny under the lens of mass political behavior. What follows is an item-by-item analysis of the validity of the mythical perception of Asian Americans. I conclude with a summary remark of findings. A description of the survey methodology and a profile of the survey participants appear at the end of this paper.
Myth 1: They are the yellow race, monolithic, all the same?
Although the Asian population in the United States has historically been lumped together as one by U.S. society and government, it is a population with multiple racial and ethnic origins and with a wide range of population size and growth rate across ethnic groups. According to the 2000 U.S. Census, 1.7 million or 14 percent of the 11.9 million people who identified themselves as Asian were of at least one other race than Asian, with the most common combination being “Asian and White” (52%). A total of 25 distinct ethnic origins were tabulated in the Census 2000 Brief for the Asian population. Among Asians who reported either of a single origin or of at least one other racial or ethnic origin, Chinese was the largest ethnic group (2.73 million), followed by Filipino (2.36 million), Asian Indian (1.90 million), Korean (1.23 million), Vietnamese (1.22 million), and Japanese (1.15 million). Using these figures to compare with the 1990 Census data, Asian Indians experienced the highest growth rate (133%) over the last decade, followed by the Vietnamese at 99 percent, the Chinese at 75 percent, Filipinos at 68 percent, Koreans at 54 percent, and the Japanese at 36 percent.
Myth 2: Foreigner, for most are foreign-born?
About every two out of three Asian Americans were born outside of the United States, according to the 1990 census. In November elections 1994-2000, an average of 46 percent of foreign-born adult Asians in the Current Population Survey (CPS) were naturalized U.S. citizens. That percentage in the 2000-01 MAAPS is 66 percent. An average of six in ten Asians in these national surveys (58%) were U.S. citizens. Data from the Immigration and Naturalization Service also show that Asian immigrants tend to become naturalized much earlier and at much higher rates than immigrants from other world regions. This immigrant majority population is by no means a foreign population by citizenship.
Myth 3: Unassimilable, can’t speak English?
Of the 6.33 million Asian persons age 5 or over enumerated by the U.S. Census in 1990, only 25 percent did not speak a language other than English at home. This does not mean, however, that the majority of Asian Americans are deficient in English proficiency. In fact, the majority of Asian Americans rated themselves as speaking English well or very well in 1990. Except for the Hmong population, the majority in each Asian ethnic group, including the foreign-born, identified themselves as relatively fluent in the English language. In the MAAPS, 26 percent of all respondents use English, 48 percent use a language other than English, and 24 percent use a mixture of English and another language to communicate at home with other household members. Outside of the home, English use is much higher. Among all Asian American respondents, almost two-thirds (71%) use English to conduct personal business and financial transactions. English language use also varies greatly across different Asian American ethnic groups. English language use in the home is lowest among Vietnamese (2%), Chinese (4%), and Korean (10%) samples. But a much higher percentage of respondents from these groups (71% Koreans, 59% Vietnamese, and 33% Chinese) rely on the English language to conduct personal business and financial transactions.
Myth 4: Apathetic, uninterested in politics?
Participants in the MAAPS are asked how interested they are in what goes on in government. The proportion reporting that they are very interested or somewhat interested ranges from 52 percent among Vietnamese respondents to 72 percent among South Asians. Overall, 61 percent of those interviewed indicate that they are either very interested or somewhat interested in what goes on in government. Only 13 percent of Asians indicate that they are not interested in politics at all.
Myth 5: Uninformed about U.S. democratic political system?
How informed are Asian Americans about the U.S. democratic political system? The 2000 Florida election debacle gives us a unique opportunity to examine this question. We ask the MAAPS respondents, both voters and nonvoters, about their familiarity with the process of electing the U.S. president. An overwhelming majority (79%) reports either being very or somewhat familiar with the process. South Asians score the highest at 93 percent and the Vietnamese score the lowest at 65 percent.
Myth 6: Do not trust the U.S. political system and government officials?
When respondents are queried about the extent to which they trust U.S. local government officials, 7 percent indicate that local government officials can be trusted just about always, 30 percent most of the time, 44 percent some of the time, and 8 percent indicate no trust at all. Levels of trust vary among Asian American groups, with Korean Americans (43%), Filipino Americans (41%) and South Asian Americans (41%) indicating higher levels of trust just about always or most of the time than members of other groups.
An interesting comparison is the extent to which Asian Americans born in Asia feel they can generally trust U.S. government officials compared to government officials in their country of origin. Asked if they can trust the U. S. government officials more, about the same, or less than in the home country, 55 percent say more, 26 percent indicate about the same, and only 6 percent indicate less than in the home country. Again, response patterns vary greatly by country of origin. The proportion of each group reporting having more trust in U.S. officials than those in the home country ranges from 72 percent for Koreans and 67 percent for Vietnamese to 39 percent among Chinese and 29 percent among Japanese.
Myth 7: Don’t vote, unwilling to become politically integrated?
Only a minority of the adult Asian population are voters. About a quarter of adult Asians voted in elections of the 1990s, according to the CPS data. In the MAAPS, 44 percent of the respondents report having voted in the November 2000 presidential election. Japanese respondents voted at the highest proportions (63%), compared to, say, Filipinos (47%), the next highest group in voting turnout. Koreans have the lowest turnout rate at 34 percent. Non-citizenship is the most commonly cited reason for nonvoting. This is mentioned by nearly six out of ten respondents who failed to cast a vote in the 2000 presidential election. Not having registered to vote is the second most commonly cited reason, mentioned by a quarter of the non-voters. When the voting rate is calculated only among eligible voters (citizens who are registered), 82 percent of Asians report having voted. The turnout rate is highest among South Asians (93%), followed by the Vietnamese (91.5%). The turnout rates for Koreans and Filipinos are lower at 71 percent and 76 percent respectively. Clearly, Asians are not deficient in their intention to want to become politically integrated and vote. Their low overall voting rates are mostly due to the lack of satisfaction for the citizenship and voter registration requirements. Once these institutional constraints are overcome, some may vote at rates higher than the mainstream Whites.
Myth 8: Have greater interest and involvement in homeland politics?
Because of their foreign-born status, Asian Americans are suspected of having a greater interest in politics related to their home country origins than to the U.S. mainstream. We ask the MAAPS immigrant sample if they have ever participated in any activity dealing with the politics of their home countries after arriving in the United States. A lofty 94 percent answer no to the question, ranging from 4 percent for Chinese and Korean to 10 percent for Vietnamese American respondents. These figures are much lower than the foreign-born sample’s rates of voting (38%) and registration (46%)in the United States.
Nevertheless, most of the Asian Americans who take part in the survey maintain strong social ties with people in their countries of origin. For example, a quarter of the Asian-born sample have contacted with people in their country of origin (by mail, phone, or in person) at least once a week. Among South Asians, 44 percent are in contact with someone in their country of origin at least once a week. Twenty percent of Filipino immigrants and 22 percent of Chinese and Korean immigrants have maintained contact with people in their countries of origin at least once a week. A large majority of those in every ethnic group category are in contact with individuals in their country of origin at least once a month.
Myth 9: Hyperactive in making illegal campaign donations?
A combination of perceived relative affluence, strong homeland connections, and the lack of U.S. citizenship and the vote may compel the politically interested Asians to rely on checkbook to express their political opinions. According to this legend, a majority of Asians, especially the foreign-born, may make more frequent use of political donations than other means of political expression to influence U.S. politics. When we ask the MAAPS respondents if they have ever participated in a variety of political activities in their community other than voting during the preceding four years, only a small segment report some participation. The most common mode is working with others in the community to solve a problem (21%), followed by signing a petition for a political cause (16%), and attending a public meeting, political rally, or fundraiser (14%). Only 12 percent of all Asians report having donated money to a political campaign. And Japanese (20%), rather than Chinese (8%), respondents are more likely to report such participation. Moreover, the percentage of donors among the foreign-born (10%) is lower than the percentage among the U.S.-born (17%)–a pattern true with practically all types of political activities except for voting among the naturalized.
Myth 10: Clannish, don’t mix up with people of other origins?
We use three measures to indicate respondents’ degree of interracial connections: cross-racial friendship, perceived racial make-up of neighborhood, and approval of intermarriage. Most respondents in the survey are part of an interracial social network. Although close of half of all respondents (46%) mention having a close personal friend who’s Asian, 31 percent mention having a White close friend, 27 percent mention having a Black close friend, and 26 percent reported having a close Latino friend. In contrast, only one-fifth of the respondents report residing in mostly Asian neighborhood (20%). Close to half of the respondents report living in pretty evenly mixed neighborhood (45%). A quarter of the respondents report having mostly white neighbors, but less than 5 percent of them report having mostly black or mostly Latino neighbors. When queried about their attitude toward someone in the family marrying a person of different ethnic background than theirs, few respondents express disapproval (11%). The highest disapproval rate of 24% is found among Koreans. The lowest disapproval rates are found among Japanese (4%), Filipinos (5%), and Vietnamese (7%). In fact, close to three quarters of the respondents from these three groups either approve or strongly approve of intermarriage, which is higher than the Asian average of 54 percent. None of the results suggest that Asians only make friends with, live by, and support marriage only among Asians.
Myth 11: Model Minority, complacent, issue free?
To see if the average present-day Asian Americans are issue-free, we ask MAAPS respondents to mention the most important problem facing their respective ethnic community. We find that respondents in each ethnic group appear to have a different degree of issue concerns and a different list of issue priorities in mind. For Chinese, the top community issues include language barriers, racial and ethnic relations, and unemployment or inadequate job opportunities. For Koreans, many share the concern over language, but they are also concerned about the lack of cohesion inside the community and problems dealing with teenagers. Vietnamese respondents prioritize their concerns over gangs, drugs, employment, and housing opportunities. Nevertheless, at least four out of ten Japanese (49%), South Asians (47%), and Filipinos (41%) report seeing no problem facing their respective ethnic community, while at least one out of five respondents in these ethnic groups are unsure if there is a problem. When a problem is reported, the most frequently mentioned among the Japanese is discrimination; for Filipinos, language barrier and breaking down of family structure; for South Asians, unemployment or job opportunities.
Importantly, although English-speaking respondents of Japanese, Filipino, and South Asian descent are much less likely to identify community problems, they are not less likely to report being a victim of hate crimes. Between 15 to 19 percent of respondents in these three communities have been verbally or physically abused or had properties damaged due to racial- and ethnic-based discrimination. Neither are members of the three ethnic communities less likely to report ever being personally discriminated in the U.S. An average of 4 in 10 respondents from each ethnic group have experienced racial and ethnic discrimination.
Myth 12: Conservative, Republican?
Are Asian Americans more likely to consider themselves as conservative or liberal? Overall, 8 percent of the MAAPS respondents classify themselves as very liberal, 28 percent as somewhat liberal, 32 percent as middle of the road, 18 percent as somewhat conservative, and 4 percent as very conservative. Ten percent are not sure where to place themselves. Chinese (42%), Vietnamese (47%), and Japanese (37%) are more likely to classify themselves as middle of the road. Filipinos (40%) and South Asians (61%) are more likely to identify themselves as very liberal or somewhat liberal than are the Chinese (30%), Koreans (33%), Vietnamese (22%), and Japanese (34%). Thirty-four percent of Filipinos place themselves in one of the conservative categories, as do 31 percent of Koreans and 24 percent of the Japanese. Only 17 percent of South Asians, 13 percent of the Chinese, and 9 percent of the Vietnamese consider themselves to be conservative.
When asked about their party affiliations, 36 percent of the MAAPS respondents identify themselves as Democrat, 14 percent as Republican, and 13 percent as Independent. Alarmingly, overall 20 percent do not think of themselves in partisan terms and 18 percent are either uncertain about their party identification or refuse to give a response. To put it another way, half of Asian Americans in the survey do not identify with a major American political party. Among independents, a higher percentage lean toward the Democratic party (32%) than the Republican party (21%); again, close to half refuse to think in partisan terms. Group differences exist in patterns of party affiliation. Between the two major parties in the United States, Japanese (40 percent to 9 percent), Chinese (32 percent to 8 percent) and South Asians (44 percent to 13 percent) are most likely to affiliate with the Democratic party over the Republican party. Filipinos and Koreans favor the Democratic Party over the Republican Party by a two-to-one margin. Only Vietnamese identify more as Republican than as Democrat (15 percent to 12 percent).
Clearly, the majority of the present-day Asian Americans are neither conservative in political ideology nor Republican in political party identification.
Myth 13: Politically fragmented, can’t vote as a bloc?
We assess the evidence of Asian Americans’ ability to vote as a bloc with two questions in the MAAPS. This first is presidential vote choice among voters in the November 2000 election. In this historic election, 55 percent of Asian American voters reported casting a vote for Al Gore, 26 percent for George Bush, and 1 percent for Ralph Nader. Eighteen percent of respondents either refused to report their vote choice or were not sure. The percentage of voters favoring Gore ranges from as high as 64 percent among the Chinese to as low as 44 percent among Koreans. Nevertheless, Gore receives a higher proportion of the presidential vote than Bush in every ethnic group. Although Vietnamese voters give the highest percentage of support for Bush (35%), it is almost 20 percentage points below the group’s support for Gore (54%). Among respondents who report their vote for president, two-thirds prefer Al Gore to George Bush. Support for Gore is highest among Japanese and Chinese Americans, who favor Gore to Bush by more than a three-to-one margin.
The second question, asked of all the respondents, voters or not, is a hypothetical scenario on candidate choice: If you have an opportunity to decide on two candidates for political office, one of whom is Asian American. Would you be more likely to vote for the Asian American candidate, if the two are equally qualified? Sixty percent answer affirmatively; support is especially high among the Vietnamese, Chinese, and Korean respondents. These respondents are asked if they would vote for the Asian American even if he or she is less qualified, only a quarter answer affirmatively to this and support is particularly low among the Vietnamese. This suggests that, for Asian Americans, ethnicity may be an important factor but candidate quality may be an even more important consideration. Nevertheless, there’s ample evidence of a voting bloc or the potential of it in the survey.
Myth 14: Have no sense of a common identity and consciousness?
The ultimate challenge for any emergent community is the formation of a common fate among rank-n-file members. Do average Asian Americans share a common sense of identity? We assess this issue by asking a set of questions on (pan)ethnic self-identity, perceived shared culture, and (pan)ethnic shared fate. First, given a choice between identifying oneself as American, Asian American, Asian, ethnic American (e.g., as Chinese American), or simply in terms of one’s ethnic origin (e.g., as Chinese), the MAAPS respondents are most apt to indicate an ethnic-specific identity. Among all respondents, 34 percent choose to identify as ethnic American and 30 percent by ethnic origin alone. Only 15 percent identify themselves as “Asian American” and 12 percent as “American”. When respondents who did not choose “Asian American” are asked to indicate if they ever think of themselves as Asian American, about half of respondents report such a panethnic identification. Thus, cumulatively, close to six out of ten respondents may identify with the panethnic “Asian American” label. This panethnic identification is most strongly felt among South Asians and least strongly among Koreans and Japanese.
We also examine panethnicity or pan-Asian group identity as a sense of shared culture. Although only about one out of every ten respondents agree that different Asian groups in America are “very similar” culturally, four out of ten respondents (41%) believe that different Asian groups in America are somewhat similar culturally. There is a remarkable uniformity across all ethnic groups on this question.
A third window into panethnic identity is a sense of a common destiny. About half of respondents (49%) believe that “what happens generally to other groups of Asians in this country will affect what happens in your life.” But there is a great deal of variation across groups. Koreans (61%), Filipinos (54%), and South Asians (53%) are more likely to perceive a general linked fate among Asian Americans. Less than half of Chinese and Japanese and only 36% of Vietnamese view Asians as sharing a common destiny.
These indicators provide some, but not overwhelmingly strong, evidence of a sense of common fate among the mass Asian Americans. Given the strength of the ethnic-specific orientation and the tremendous heterogeneity within the Asian American community, these results not only provide grounds for optimism about the possibilities of forming a pan-ethnic coalition among Asian Americans, but more importantly they spell out the need for political leadership to deliver such a vision.
What do Asian Americans think and act politically? The discussion above shows that, at the dawn of the 21st century, Asian Americans are ethnically and racially diverse, socially connected with, and rapidly becoming political integrated into the U.S. mainstream. Although most immigrants maintain a strong ethnic bond with homeland culture and people and are more concerned about language barriers than other issues, the majority members in the community do not show a deficiency in using English outside of the home nor a greater interest or involvement in homeland politics. Rather, an overwhelming majority of Asian American are informed of the presidential election process, show some or higher interest in U.S. politics, trust U.S. local and state government officials at least some of the time, have more trust in the U.S. than the homeland government officials, and have turned out to vote once jumping the barriers of citizenship and voter registration requirements. Instead of being politically fragmented, the majority of the politically adapted tend to think and vote the same. Far from belonging to a monotonous, issue-free community, members in each ethnic group have a different degree and set of issue concerns, but they also share a similar level of experience with racial and ethnic discrimination. Although most prefer an ethnic-specific rather than a panethnic identity, the majority respondents are also amenable to the panethnic Asian American label and favor electing political candidates of Asian American descent. These results suggest that the immigrant-majority and multiethnic community is becoming a political force to be reckoned with and their political participation can matter and will matter more in national and local politics with the passage of time.
Description of Survey Methodology
A total of 1,218 adults of Chinese, Korean, Vietnamese, Japanese, Filipino, and South Asian descent residing in the Los Angeles, New York, Honolulu, San Francisco, and Chicago metropolitan areas were randomly selected and interviewed by phone between November 16, 2000 and January 28, 2001. Telephone households in these five metropolitan areas—chosen for their large Asian ethnic populations, geographic location, and concentration of particular ethnic groups—were sampled using a dual-frame approach consisting of random-digit dialing (RDD) at targeted Asian zipcode densities and listed-surname frames. Only telephone households occupied by adults self-identified as belonging to one of the six major Asian American ancestries were included in this study. For our New York and Chicago samples only the listed-surname approach was used. Within each sampling area, the selection probability for each ethnic sample was to approximate the size of the ethnic population among Asian Americans according to the 1990 Census. However, we over-sampled the Vietnamese and South Asians to generate a sufficiently large sample sizes. Within each contacted household, the interviewer would ask to speak with adult 18 years of age or older who most recently had a birthday. To increase the response rate, multiple call attempts were made at staggered times of the day and days of the week, with break-offs and refusals re-contacted.
This sampling design yielded a final sample of 308 Chinese, 168 Korean, 137 Vietnamese, 198 Japanese, 266 Filipino, and 141 South Asians or an average of 200 completed interviews from each Metropolitan Statistical Area (MSA) and an additional 217 interviews from the Los Angeles Metropolitan Area. Based on the English proficiency rate of each Asian subgroup and practical cost concerns, English was used to interview respondents of Japanese, Filipino, and South Asian descent; respondents of Chinese, Korean, and Vietnamese descent were interviewed in their language of preference. Among the Chinese, 78% chose to be interviewed in Mandarin Chinese, 19% in Cantonese, and 3% in English. Close to 9 out of 10 Koreans (87%) chose to be interviewed in Korean. Nearly all Vietnamese respondents (98.5%) chose to be interviewed in Vietnamese. The average interview length is 27 minutes for interviews conducted in the respondent’s non-English language and 20 minutes for interviews conducted in English. The average incidence rate for interviews drawn from the listed surname sample is 41%, with a range from 14.5% for the Filipino sample to 81% for the Chinese sample. The incidence rate for RDD interviews is 15%, which ranges from 4.6% for Korean to 24% for Japanese sample. The average refusal rate is 25%, with 34% in the listed sample and 3.5% in the RDD sample. The margin of sampling error for the entire survey is plus or minus 3%, it is doubled for the Chinese portion of the survey.
In addition to random error innate to a scientific survey, the representativeness of our survey may be limited by our sampling design, which may omit households with unlisted telephone numbers or persons who do not bear identifiable surnames in the targeted study areas. Samples generated with the RDD frame may not allow coverage of households located in zipcodes that rank below the top ten ethnic density areas or with less than 10% ethnic density for a targeted Asian subgroup in each zip code. In addition, because a survey is often a snapshot of the public opinion at the time when the interviews took place, the views expressed may be affected by what happened in the environment. For example, because our survey was fielded right after the 2000 presidential election, respondents’ views on their presidential choice may be impacted by events in Florida. More generally, survey response has been known to be susceptible to the specific race and gender of the interviewer and the way a question is worded, ordered, and translated. Moreover, our sample is drawn from five major population centers, which obviously limits our ability to draw inferences about Asians or Chinese in the United States writ large. While every effort has been made to generate data that is as valid and reliable as possible, we acknowledge the likely existence of these imperfections and ask readers to use caution when making inferences about the results.
Who Participated in the Survey? A Profile of Respondents
The survey respondents are of multiple Asian ethnic origins and from five major cities of the Asian American population around the nation. One-third reside in Los Angeles, the rest are equally distributed in San Francisco, Chicago, New York, and Honolulu. About one-fourth of the respondents are of Chinese descent; of them, about seven out of ten can trace their ancestral homes to mainland China, about two out of ten originated from Taiwan, and about one-tenth were from Hong Kong. Over one-fifth of the respondents are of Filipino descent; one-sixth are of Japanese descent, and the rest are of Korean, South Asian, and Vietnamese descents. Most of Korean, Vietnamese, and Filipino respondents reside in the Los Angeles area. About six out of ten Chinese respondents reside in either Los Angeles or San Francisco. Close to half of all Japanese respondents reside in Honolulu and 39 percent of South Asians reside in the Chicago area.
Nativity and Immigration Generation. The majority of the respondents were born in Asia (76%), 14 percent of all respondents are U.S.-born but with Asian-born parents, another 10 percent were, along with their parents, born in the U.S. However, less than one-fourth (22%) of the Japanese respondents were born in Japan and over four out of ten among them are of the third or more generation. In addition, the Filipino sample was the only other group that included 10% or more third generation respondents.
Length of Local Residence. The respondents lived an average of 12.8 years in their present city or town. The average length for the Japanese is significantly higher at 26.7 years and significantly lower for South Asians at 7.9 years and for Koreans at 8.8 years. Besides the Japanese (47%), both Filipinos (16%) and Chinese (12%) also includea significant proportion of the respondents who have lived in the local area for 21 or more years.
Age and Sex. The average respondent age is 44, but a typical South Asian respondent is significantly younger at age 36 and a person of Japanese descent is older at age 49. The sample is equally divided between male and female respondents, but more males than females are represented in the Vietnamese and South Asian subsamples.
Education. About half of the sample has a college or more advanced degree. The educational achievement among South Asian respondents is especially astonishing with over one-fourth holding a post-graduate degree. Even among the respondents reporting the lowest levels of educational achievement the Vietnamese, one-third report having a college degree or more. With the exception of the Japanese sample, the majority of respondents in each ethnic group received education mainly outside of the United States. An even percentage of Filipinos received education in and outside of the United States.
Income. Many respondents were reluctant to report income. However, among those who reported their income, the results defy an image of overall affluence. Respondents in each ethnic group differ somewhat in terms of the “most common” categories of family income they indicated. For example, the most common category for the Chinese is “between $10,000 and $19,999”. The average income category for Japanese and Filipinos is “between $40,000 and $59,999”. The two most common categories for Koreans and South Asians are “between $40,000 and $59,999” and “over $80,000”. However, for the Vietnamese, the two most common categories are “between $10,000 and $19,999” and “between $30,000 and $39,000”.
Religion. The respondents also differ greatly in religious belief. Close to seven out of ten (68%) Filipinos are Catholic and a similar proportion of Koreans are Christians. Close to half (49%) of Vietnamese respondents are Buddhist and 46 percent of South Asians are Hindu. However, over one-fourth of Japanese (26%) and close to 40 percent of Chinese respondents do not have a religious preference.
Copyright (c) Asian American / Asian Research Institute (AAARI), 2002.
All rights reserved. No part of this transcript may be reproduced or distributed in any form or by any means without explicit permission of the Asian American / Asian Research Institute.
Recording and transcription services are provided by Transcendent International, LLC.
If you wish to receive a CD containing the conference proceedings in audio and PDF transcripts, contact 1-800-497-1031 or info@TranscendentIntl.com.